The Tree of Life

The Evogeneao Tree of Life diagram, and the generation counting technique used herein, was inspired by Dr. Richard Dawkins’ wonderful book The Ancestor's Tale. The smallest branches are purely illustrative and help to suggest the effect of mass extinctions on diversity, and changes in diversity through time. The Evogeneao Tree of Life diagram is NOT intended to be a scholarly reference tool! It is intended to be an easy-to-understand illustration of the core evolution principle; we are related not only to every living thing, but also to everything that has ever lived on Earth.
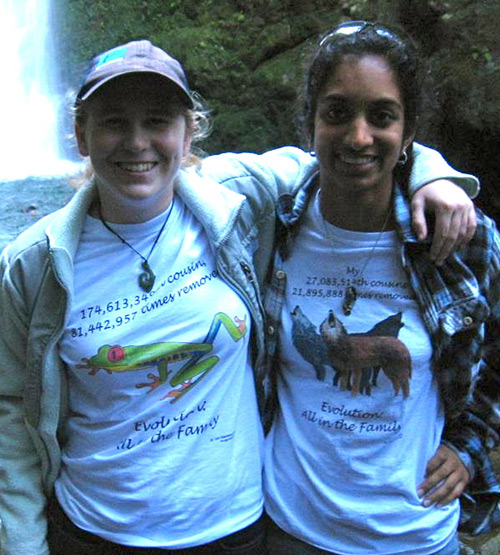
Educational posters of this Tree of Life are available from our shop. We also make custom posters of the Tree of Life using a design and size of your choice. Contact us at https://www.evogeneao.com/en/about-us/contact-us
Go to our page for teachers to see how the Tree of Life is used in the classroom to teach evolution.
Distortions and Limitations
In order to make the Evogeneao Tree of Life easy to understand, a number of distortions have been purposefully built in.

First, this Tree of Life is drawn from the human point of view. That is why humankind, instead of some other organism, occupies at the end of the tree, and why our vertebrate cousins (animals with a backbone) occupy a large part of the tree. This falsely suggests that humans are the ultimate goal of evolution. In fact, if that asteroid or comet that hit the earth 66 million years ago had instead missed the earth, there might not be a dominant, tool-using, space-faring species on earth. Or if one evolved, it might be a dinosaur, not a mammal.
Second, the world of bacteria holds far more genetic diversity, and accounts for far more biomass than animals and plants do, yet bacteria occupy only a relatively small portion of the Evogeneao Tree of Life. Trees of Life drawn from the bacterial point of view look very different; the whole world of animals and plants occupy only a tiny part of the tree.
If the asteroid or comet that triggered the mass extinction 66 million years ago had by chance missed our planet, the space-faring species on Earth today might be a dinosaur rather than a mammal.
Third, the Evogeneao Tree of Life suggests life steadily increased in diversity through time, such that the greatest diversity appears to exist at the present time. This is not at all the case and only appears that way because, for space reasons, only a few of the branches of life are shown. The evidence suggests that 99% of species that have ever existed on earth are now extinct.
Fourth, for space reasons many minor branches of life have not been included or labeled on the Evogeneao Tree of Life diagram. Also, the diagram suggests a specific time of common ancestry where branches join, but DNA and fossil data only suggest a broad time window in which the common ancestor lived.
Fifth, the Evogeneao Tree of Life breaks out Birds as a separate major branch, although the scientific consensus now is that birds are a branch of theropod dinosaurs that survived the mass extinction 66 million years ago. The branch could be labeled "Avian Dinosaurs," but to make the diagram easier to follow, the more familiar designation "Birds" has been retained.
Sixth, current thinking proposes that 1) Bacteria and Archaea probably evolved from a common ancestor, either a non-living proto-cell, or something alive but more primitive than either, but now extinct, and 2) that Eukaryotes evolved from Archaea. Everything alive on earth today can trace ancestry back to that common ancestor between Bacteria and Archaea, which is known as LUCA (Last Universal Common Ancestor). Hug, et al., 2016 (Nature Microbiology 1:16048)
In order to keep the diagram simple for beginning students, the Evogeneao Tree of Life shows a simple, traditional progression from Bacteria to Archaea to Eukaryotes.
Seventh, for a recent common ancestor, we can reasonably be sure it didn't look too different from a modern descendant, and fossil data is often available to guide the illustrations that we've created for the Evogeneao Tree of Life Explorer.
But science has only an approximate idea of what ancient common ancestors may have looked like. For these ancient ones, we've made highly speculative illustrations and assumed in most cases that they looked like a modern example of the next oldest branch. This assumes that little evolutionary change has taken place in the form of that organism, which is a big assumption. But this admittedly flawed protocol has been followed, rather than just replace those common ancestor illustrations with a big question mark.
Teachers are encouraged to examine issues raised in the Distortions and Limitations text for those students able to dive a bit deeper into evolution.
How to Use the Tree of Life
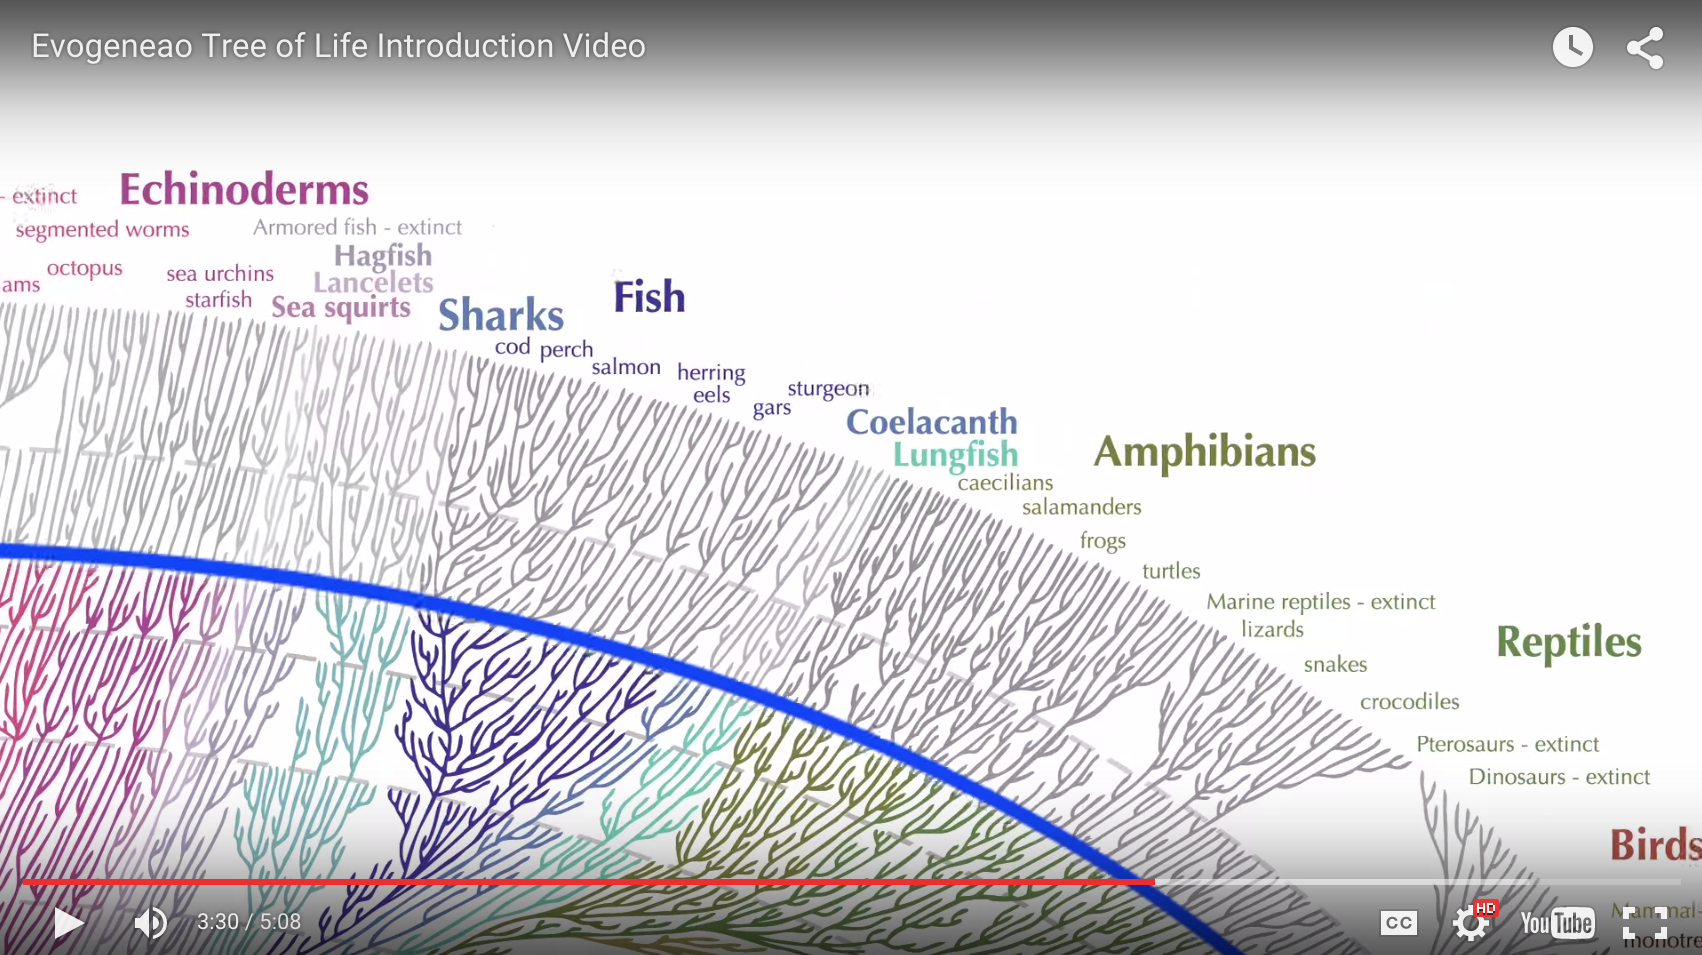
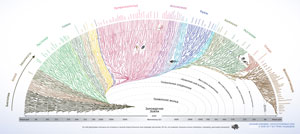
The geologic time scale begins at the center bottom, at Earth's birth, more than four billion years ago. As you move away in any direction from this point toward the outer margin of the tree, geologic time gets younger and younger, until at the outer edge of the tree you arrive at the present day. Times on the geologic time scale are shown at the base of the diagram in millions of years before the present. These are traced through the tree of life along curved, dashed lines of equal time value. Any point on the Evogeneao Tree of Life can be placed in geologic time by using these curved timelines.
Biological evolution proposes that all living things, including humans, have a common ancestor with any other living thing. On the Evogeneao Tree of Life, students can discover when in the distant past these common ancestors lived. For example, trace the human branch back through time along the yellow guidelines using the partial Evogeneao Tree of Life below. Follow it back in time to the point where you meet the bright blue fish branch. This point on the Tree of Life represents the common ancestor between humans and fish (in this case, salmon). By using the time scale, you can see that this creature lived roughly 430 million years ago. The time of a common ancestor between any two of life's branches, large or small, can be found in the same way.
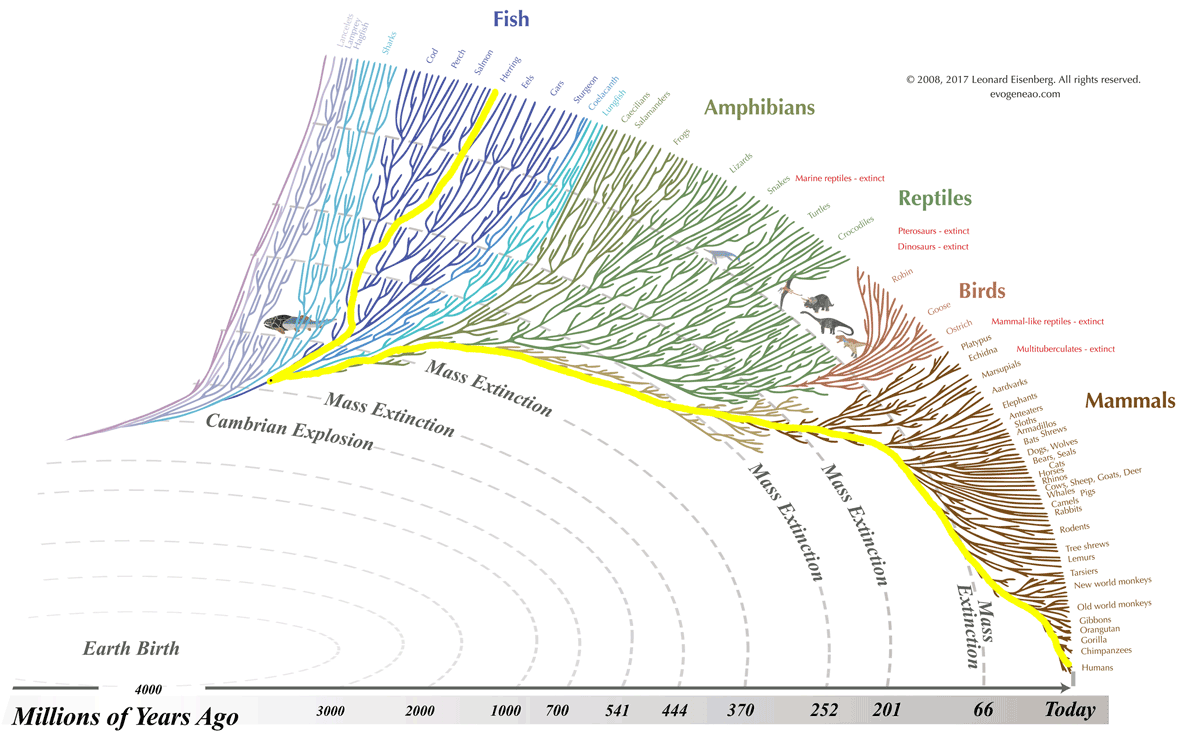
Another example: Follow the Reptile branch back in time to the point where it meets the Amphibian branch. The curved timelines indicate that the common ancestor between amphibians and reptiles lived about 355 million years ago. Each of the major branches on the Tree of Life is color-coded to make them easier to distinguish from neighboring branches.
Our Understanding Will Evolve
As our understanding of life's history improves (by fossil discoveries and genetics), some of the branching relationships and times of common ancestors depicted on this tree of life will inevitably become outdated.

Tree of Life by Ernst Haeckel
Many trees of life have been drawn since Darwin published On the Origin of Species in 1859. One of the first was by renowned German naturalist and embryologist Ernst Haeckel (1834-1919). He published this tree in his book The Evolution of Man (1879). Haeckel accepted the common ancestry of life but differed from Darwin in favoring inheritance of acquired characteristics over natural selection as the means by which species form.
The Evogeneao Tree of Life in Other Languages
Visitors to Evogeneao come from all over our planet and have voiced their support for evolution education and the fact that all Life on Earth is One Big Extended Family.
Our Tree of Life image is available in Spanish, French, German, Russian, Dutch, Catalan, and Chinese, for all of our Spanish, French, German, Dutch, Catalan, Russian and Chinese friends!

Spanish

French

German
Russian

Dutch

Catalan

Chinese
Italian
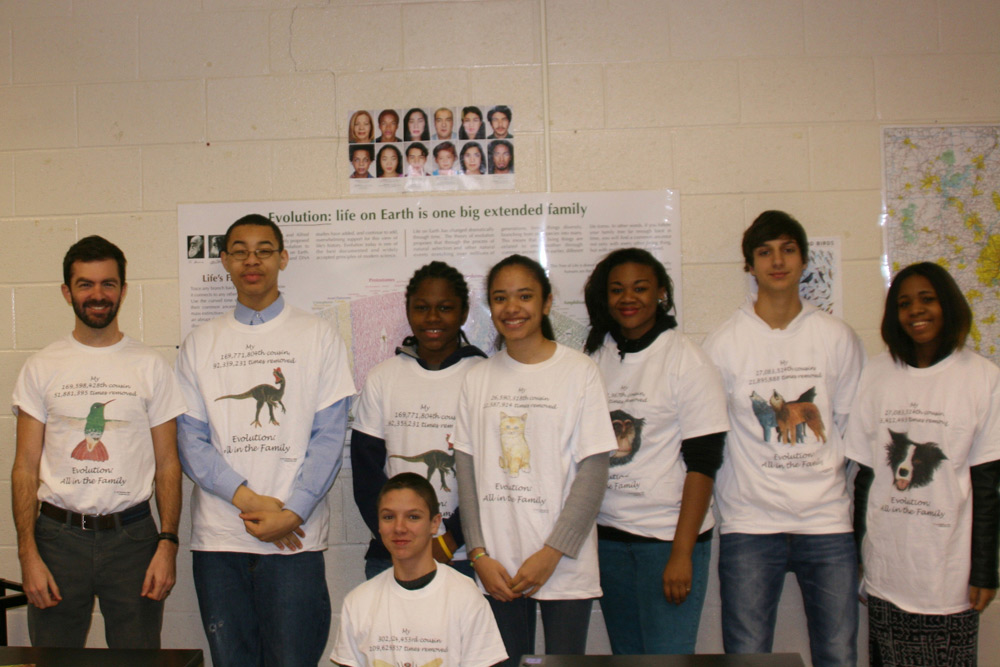
Dr. Emanuele Serrelli from the University of Milano Bicocca used Evogeneao in a science fair in Milan, Italy in the fall of 2013. We also donated a box of Evogenao tee shirts for the event, and they were a big hit! These are some of the exhibits Dr. Serrelli created to explain evolution the Evogeneao way.